Greenhouse Gas Emission Data
Public, difficult to access, and not always correct
Hanno Böck
industrydecarbonization.com
Greenhouse Gas Emission Data

UNFCCC
United Nations Framework Convention on Climate Change

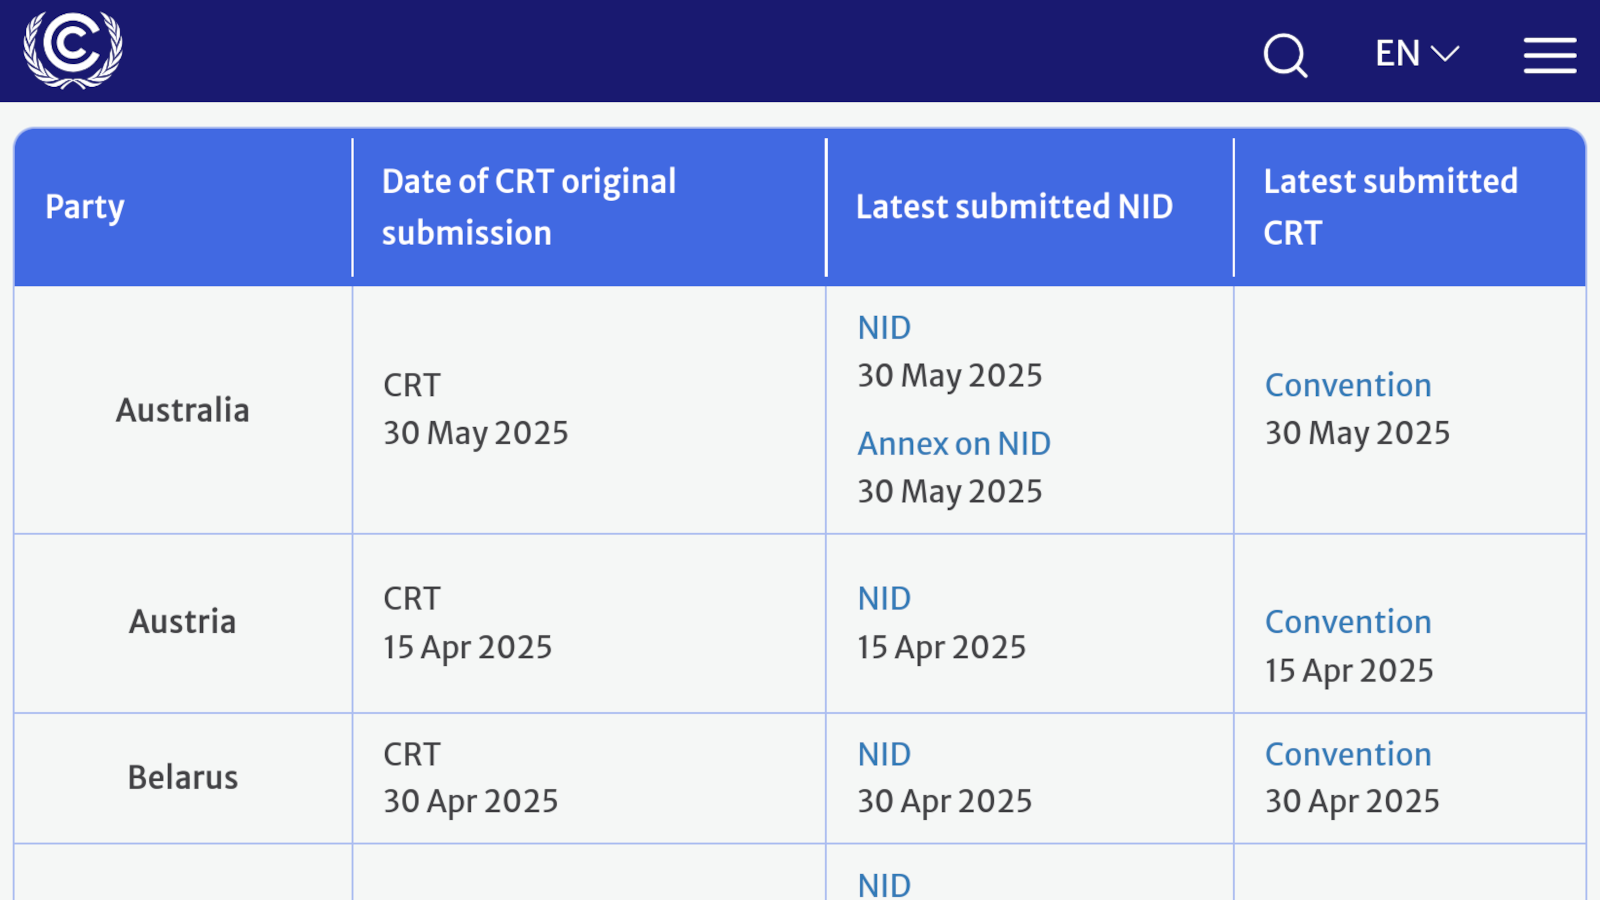
Data about country-level emissions
Common Reporting Tables (CRTs)
Excel tables
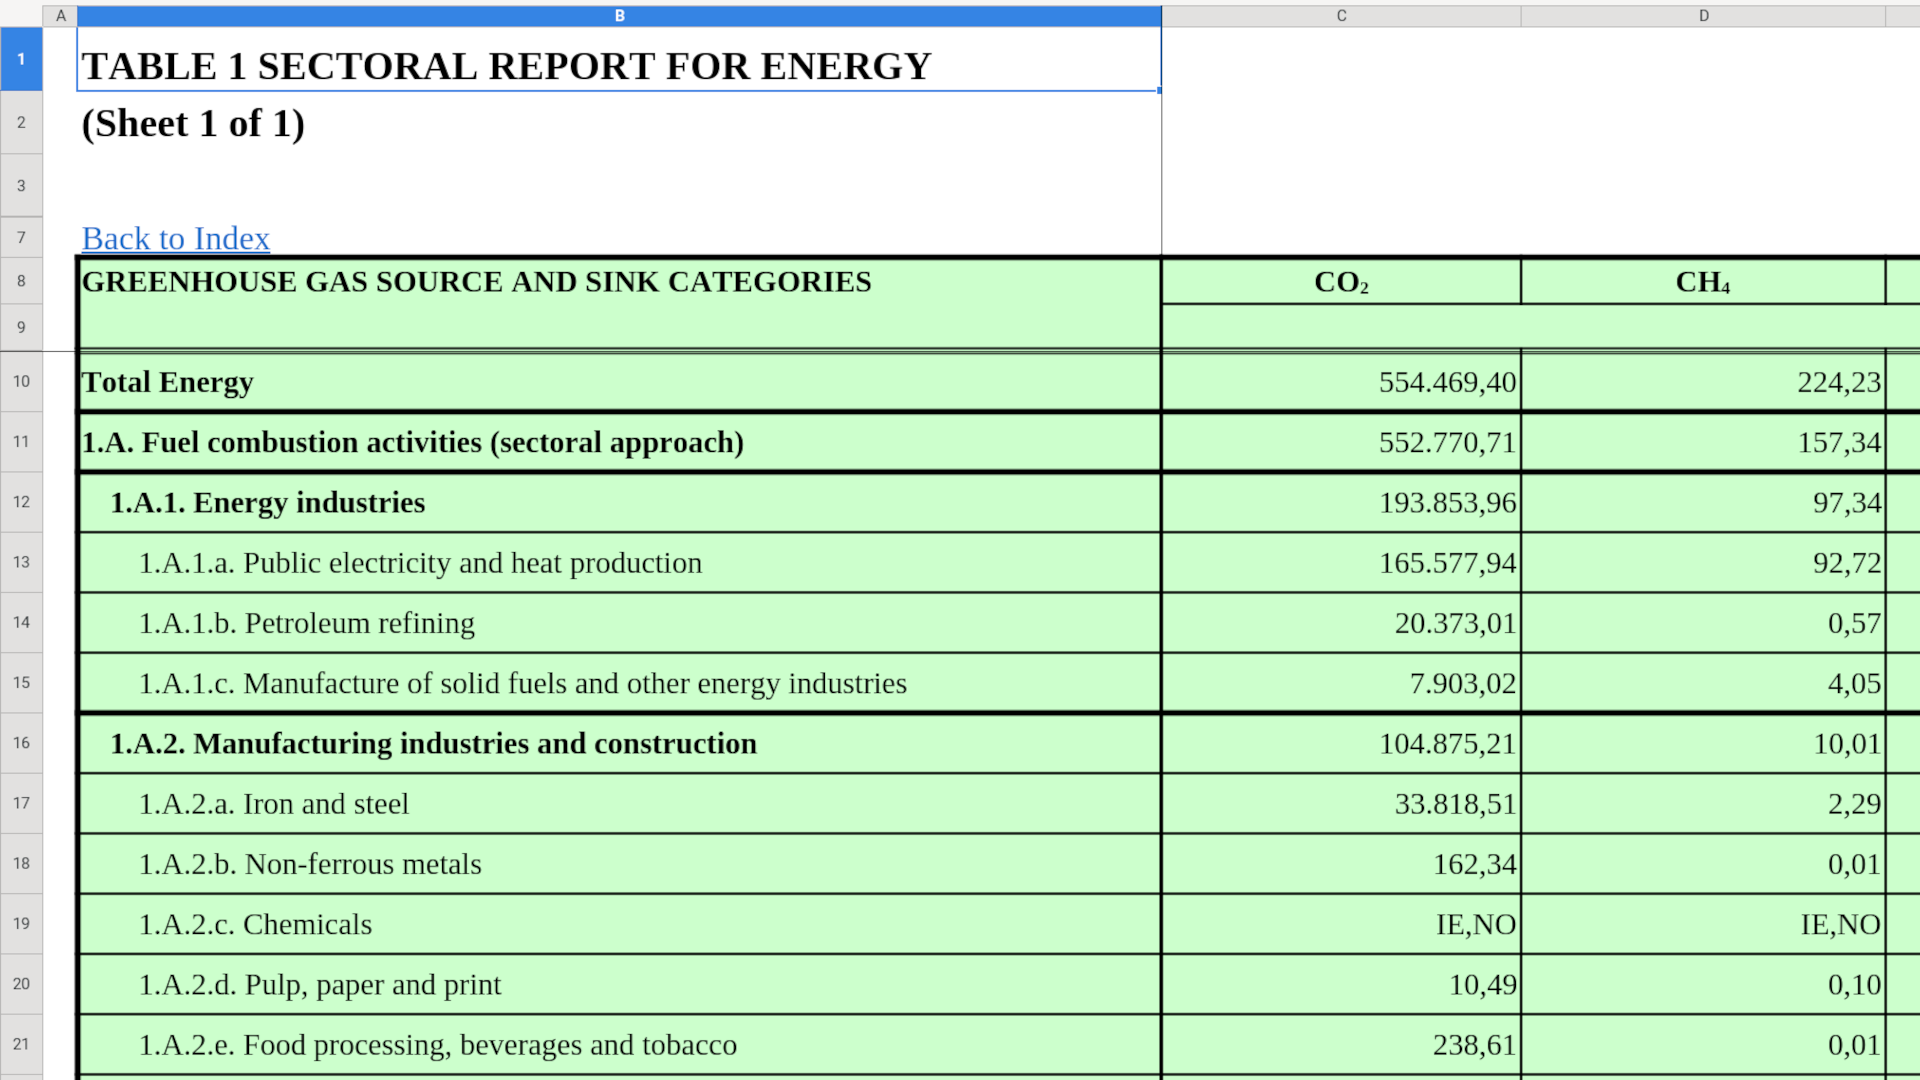
What can we do with this data?
Let's say you ask yourself:
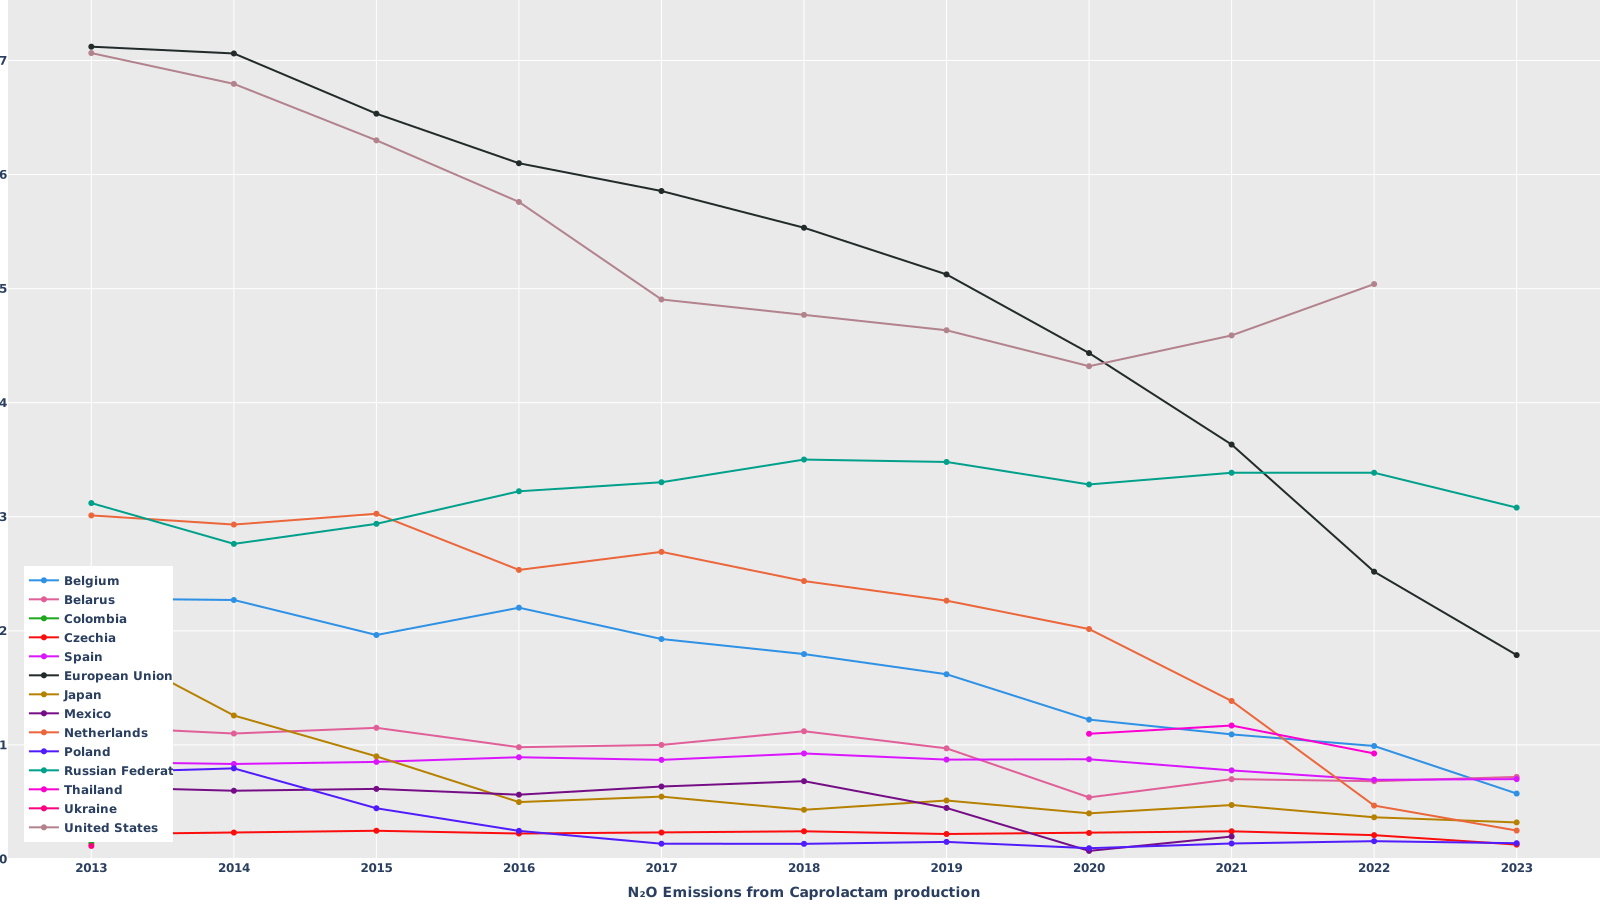
What are the N₂O Emissions of Caprolactam production in different countries?
Why is that interesting?
https://industrydecarbonization.com/news/some-of-the-cleanest-polyamide-and-nylon-precursor-factories-are-shutting-down.html
They have a Data Interface with an API, but no data after 2021
Raw Tables
One ZIP file per country
(104 countries)
Automate Downloads!
curl https://unfccc.int/ghg-inventories-annex-i-parties/2025
<html>
<head>
<META NAME="robots" CONTENT="noindex,nofollow">
<script src="/_Incapsula_Resource?SWJIYLWA=5074a744e2e3d891814e9a2dace20bd4,719d34d31c8e3a6e6fffd425f7e032f3">
</script>
<body>
</body></html>
They prevent automated Downloads with a "Security Firewall"
🔥🧱🤡
Why?
I eventually managed to download all the data (using Selenium)
https://industrydecarbonization.com/docs/unfccc/
Emissions from single factories
CO₂ Emission Sources in Potsdam
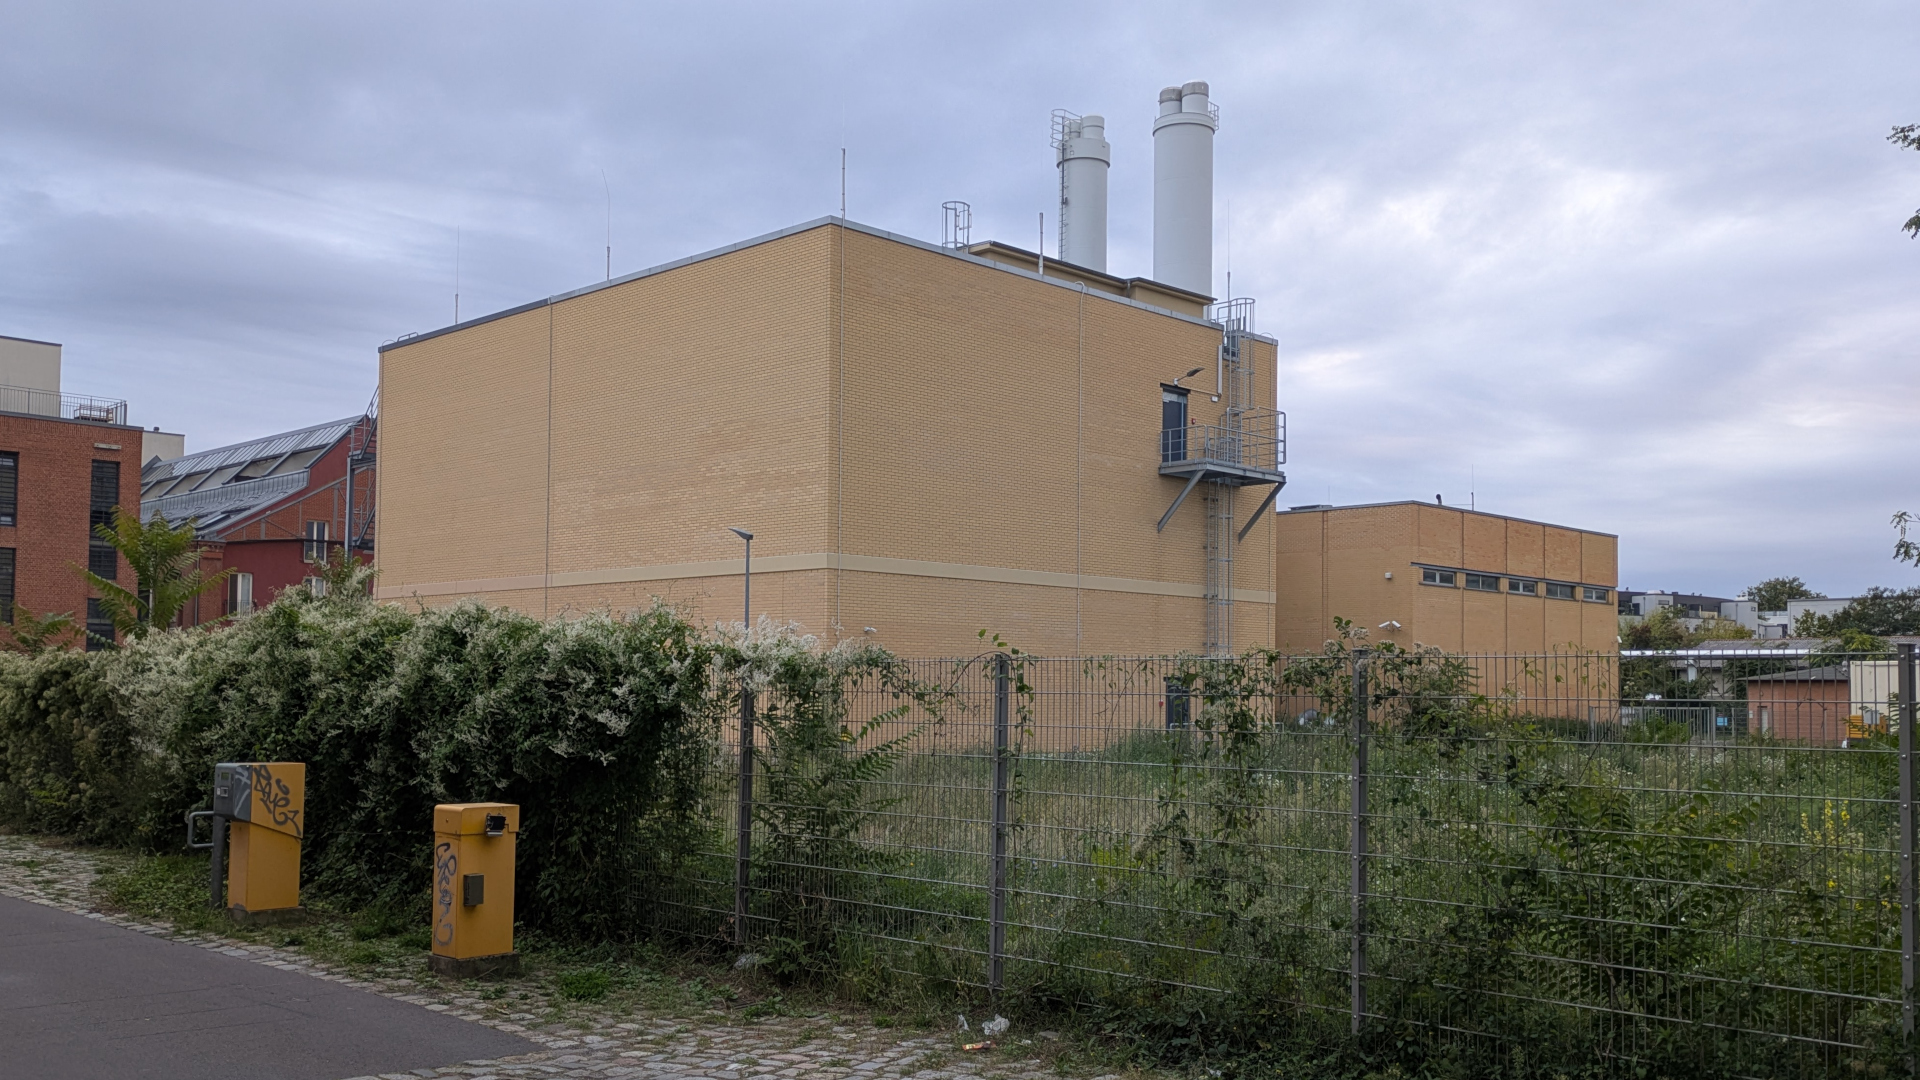 Power Plant Potsdam North |
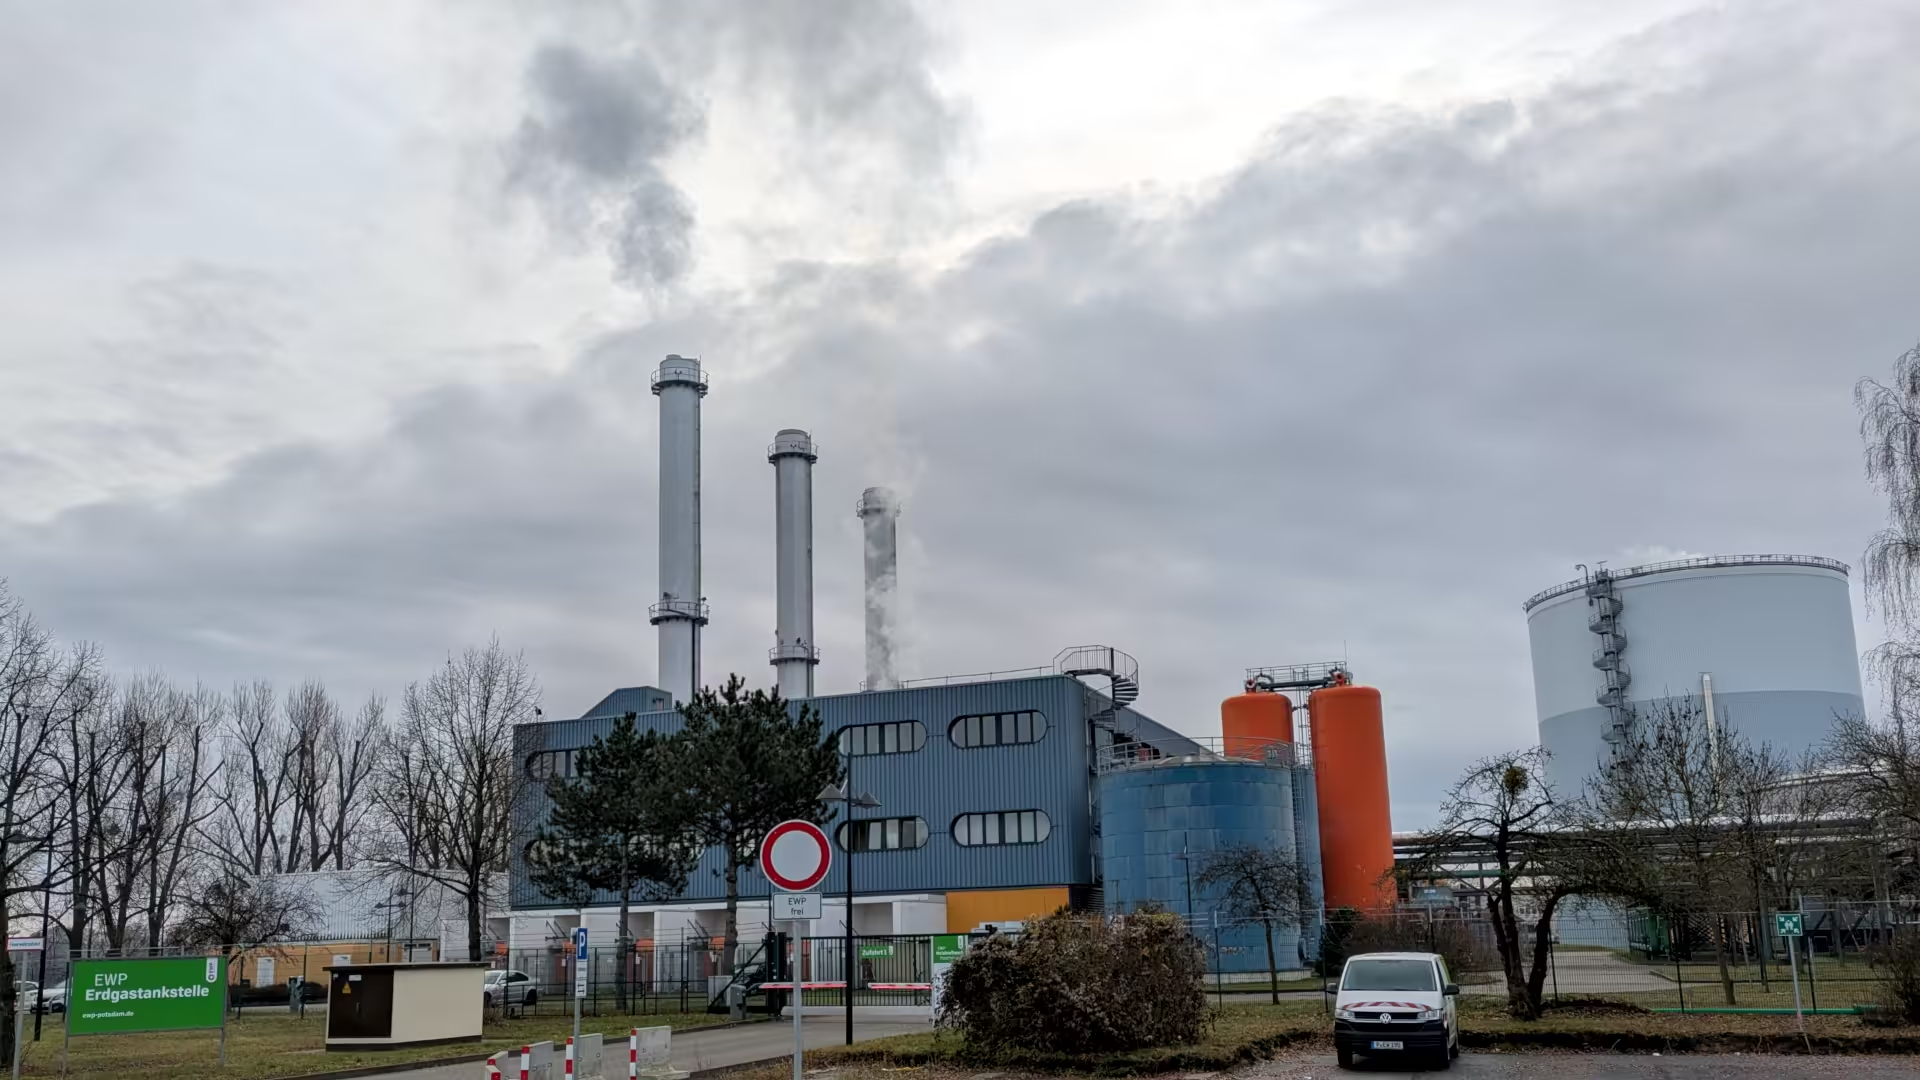 Power Plant Potsdam South |
Power Plant Potsdam South

Power Plant Potsdam North

Power Plant Potsdam North
64.054.732,83 MWh
Fossil Gas: 0,201 tCO₂/MWh
Around 13 Million Tons of CO₂
Power Plant Potsdam North
13 Million tCO₂
Power Plant Jänschwalde
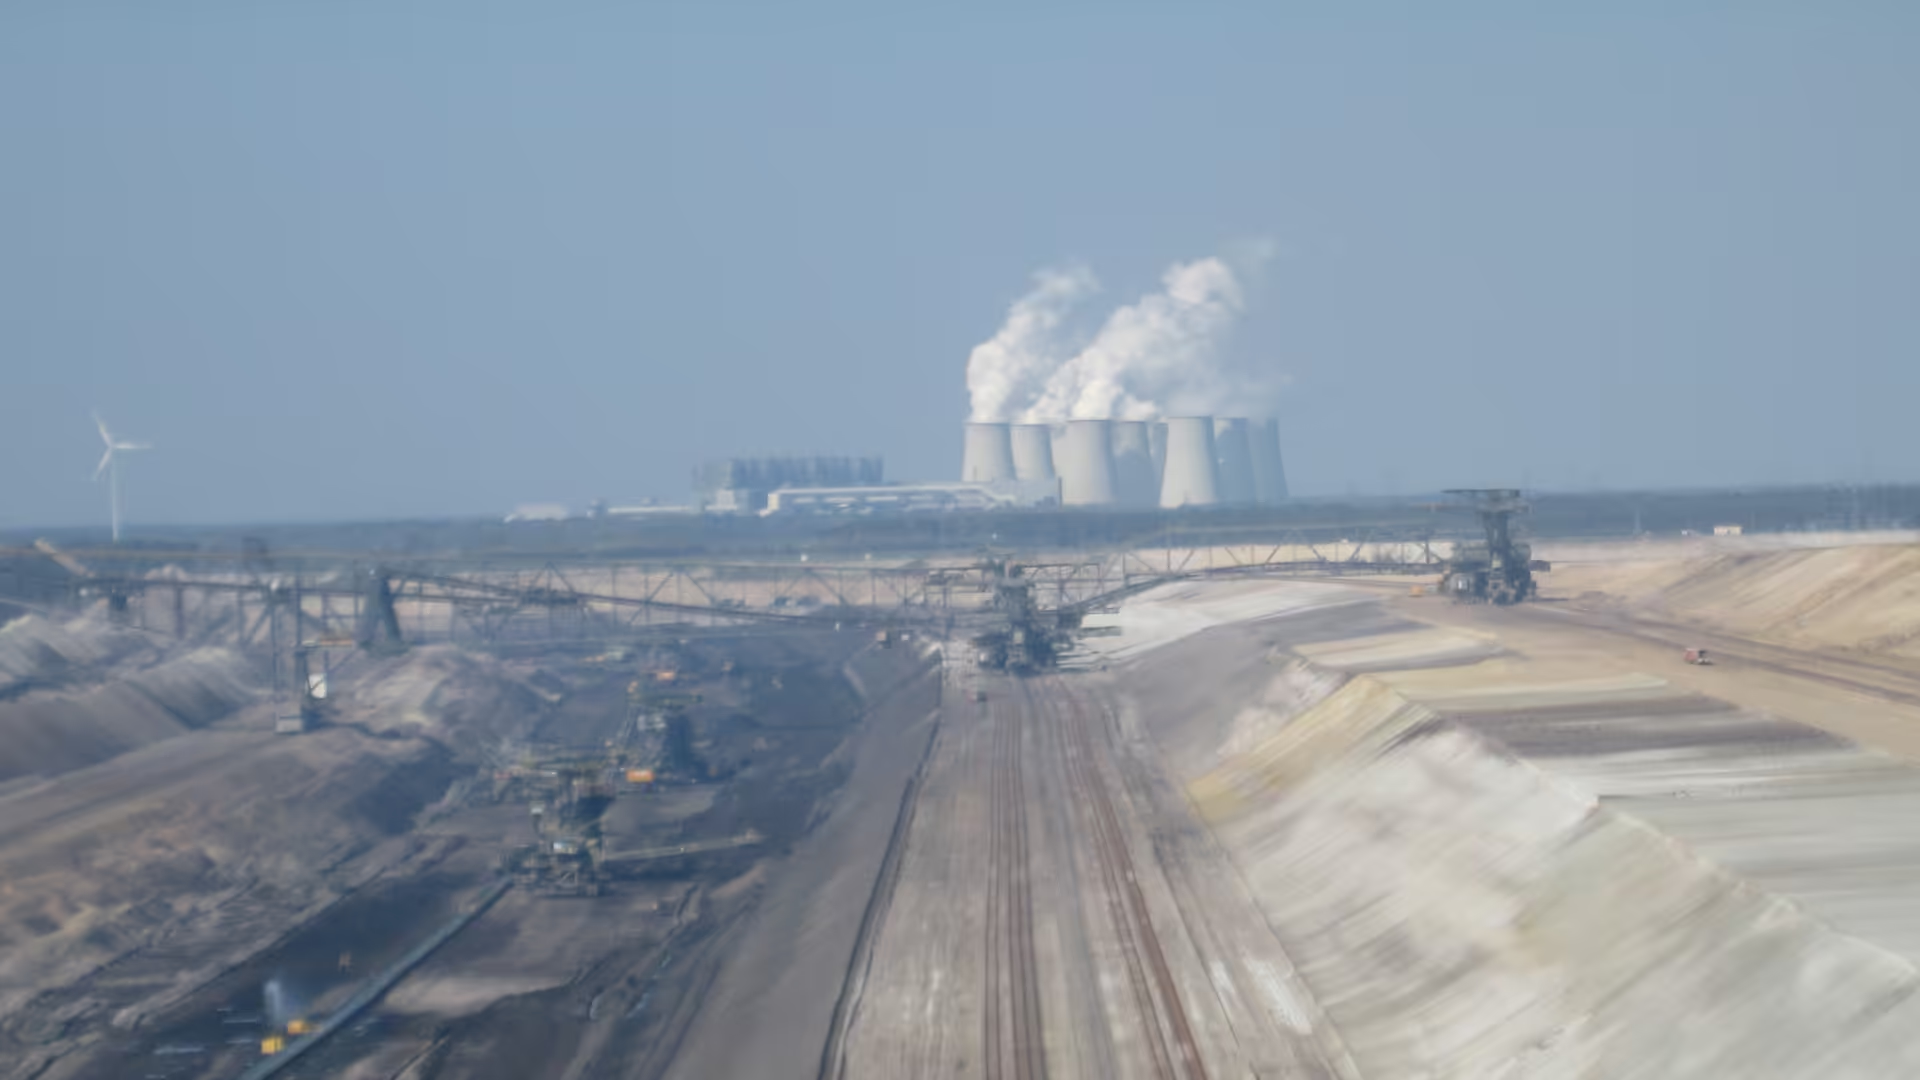
14 Million tCO₂
Kyiv Protocol on Pollutant Release and Transfer Registers

User-Friendly CSV


Let's put that into a database
https://github.com/decarbonizenews/ghgsql
Docker, MariaDB (SQL), phpMyAdmin
DEMO
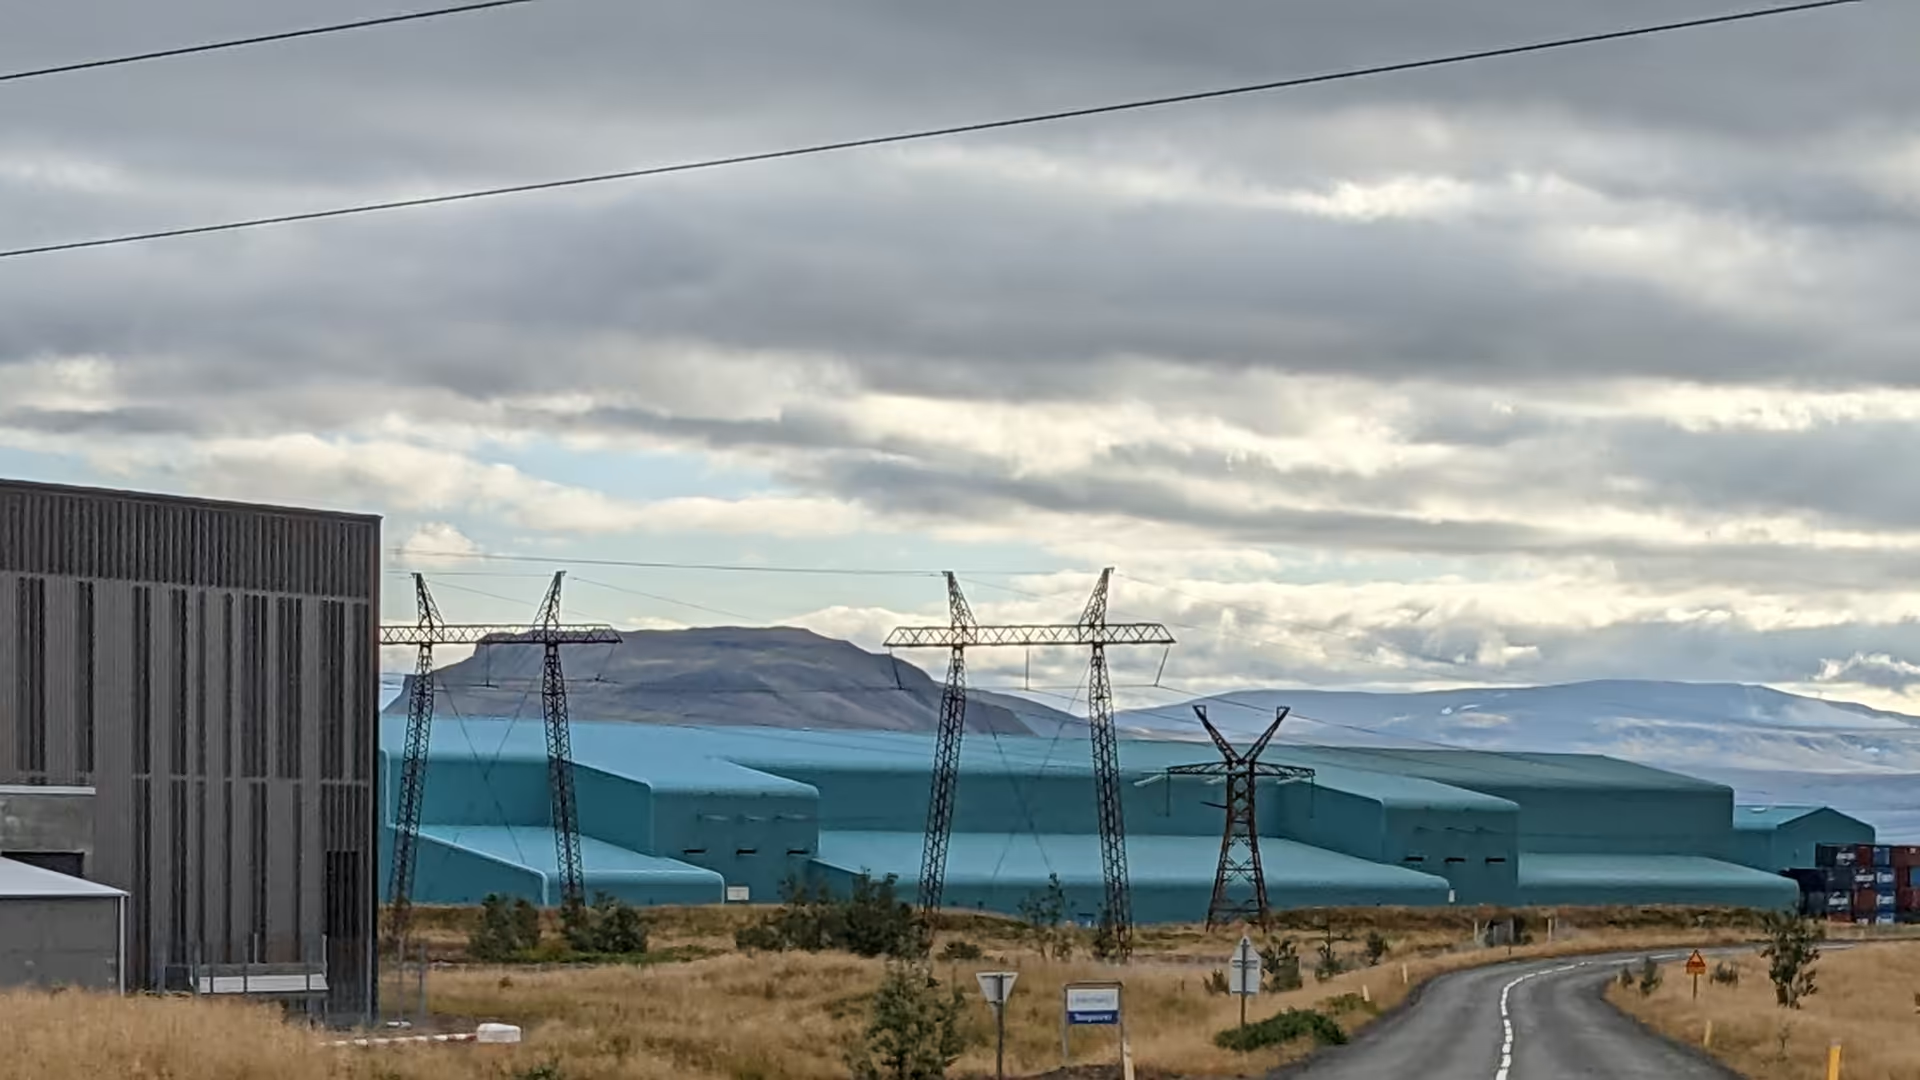
Elkem Ferrosilicon (Iceland)
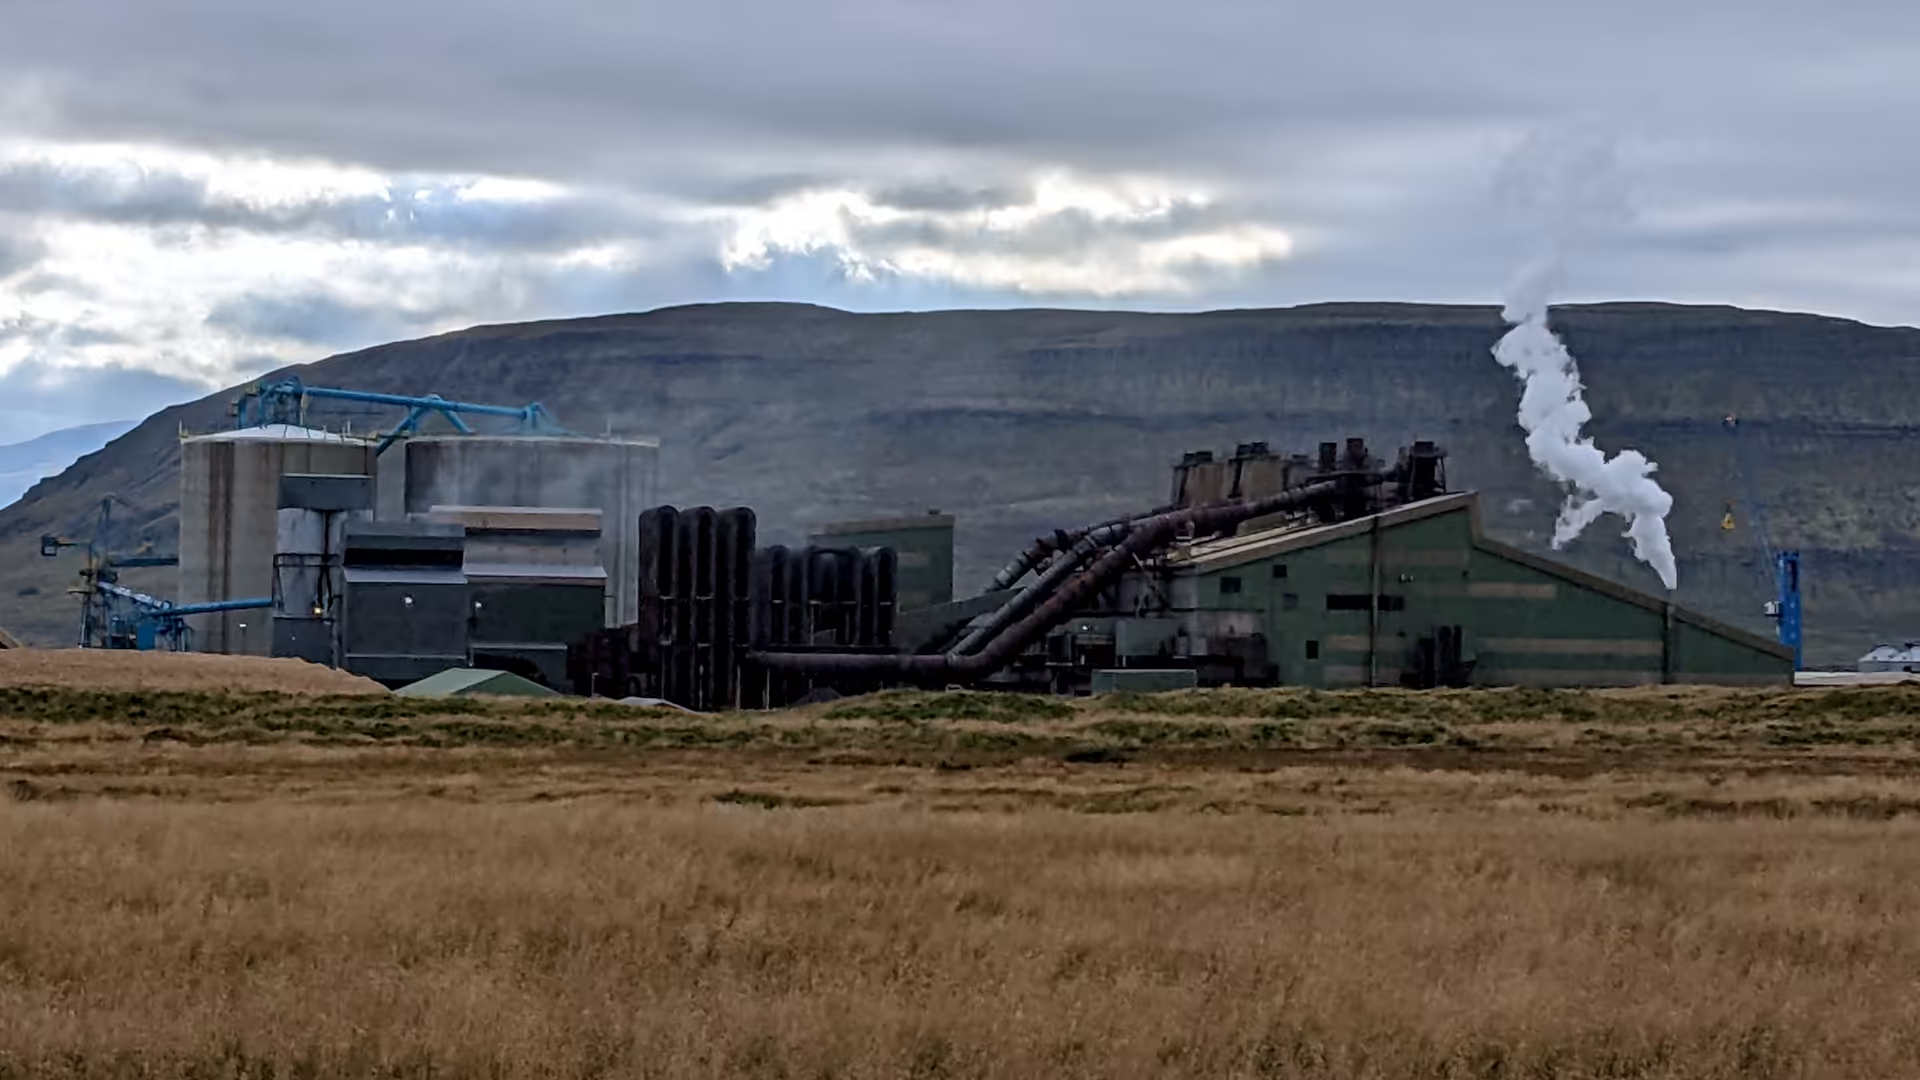
Photo: Hanno Böck
SELECT year,releases FROM eu.iep WHERE pollutant='CO2' AND country='Iceland' AND name LIKE 'Elkem%' ORDER BY year;
Elkem Ferrosilicon (Iceland, kgCO₂/year)
| 2013 | 407,000,000 |
| 2014 | 369,000,000 |
| 2015 | - |
| 2016 | - |
| 2017 | - |
| 2018 | 404,000 |
| 2019 | 332 |
| 2020 | 358,000 |
| 2021 | 375,893 |
| 2022 | 361,901 |
Alcoa Aluminium (Iceland, kgCO₂/year)
| 2013 | 532,000,000 |
| 2014 | 520,000,000 |
| 2015 | 531,000,000 |
| 2016 | 509,000,000 |
| 2017 | 535,000,000 |
| 2018 | 533,704,242 |
| 2019 | 535,888 |
| 2020 | 528,000 |
| 2021 | 493,836 |
| 2022 | 506,511 |
Norðurál Aluminium (Iceland)
| 2011 | 62,100 kgSF₆ |
(Iceland total: ~3.5 Million)
Photo: Hanno Böck
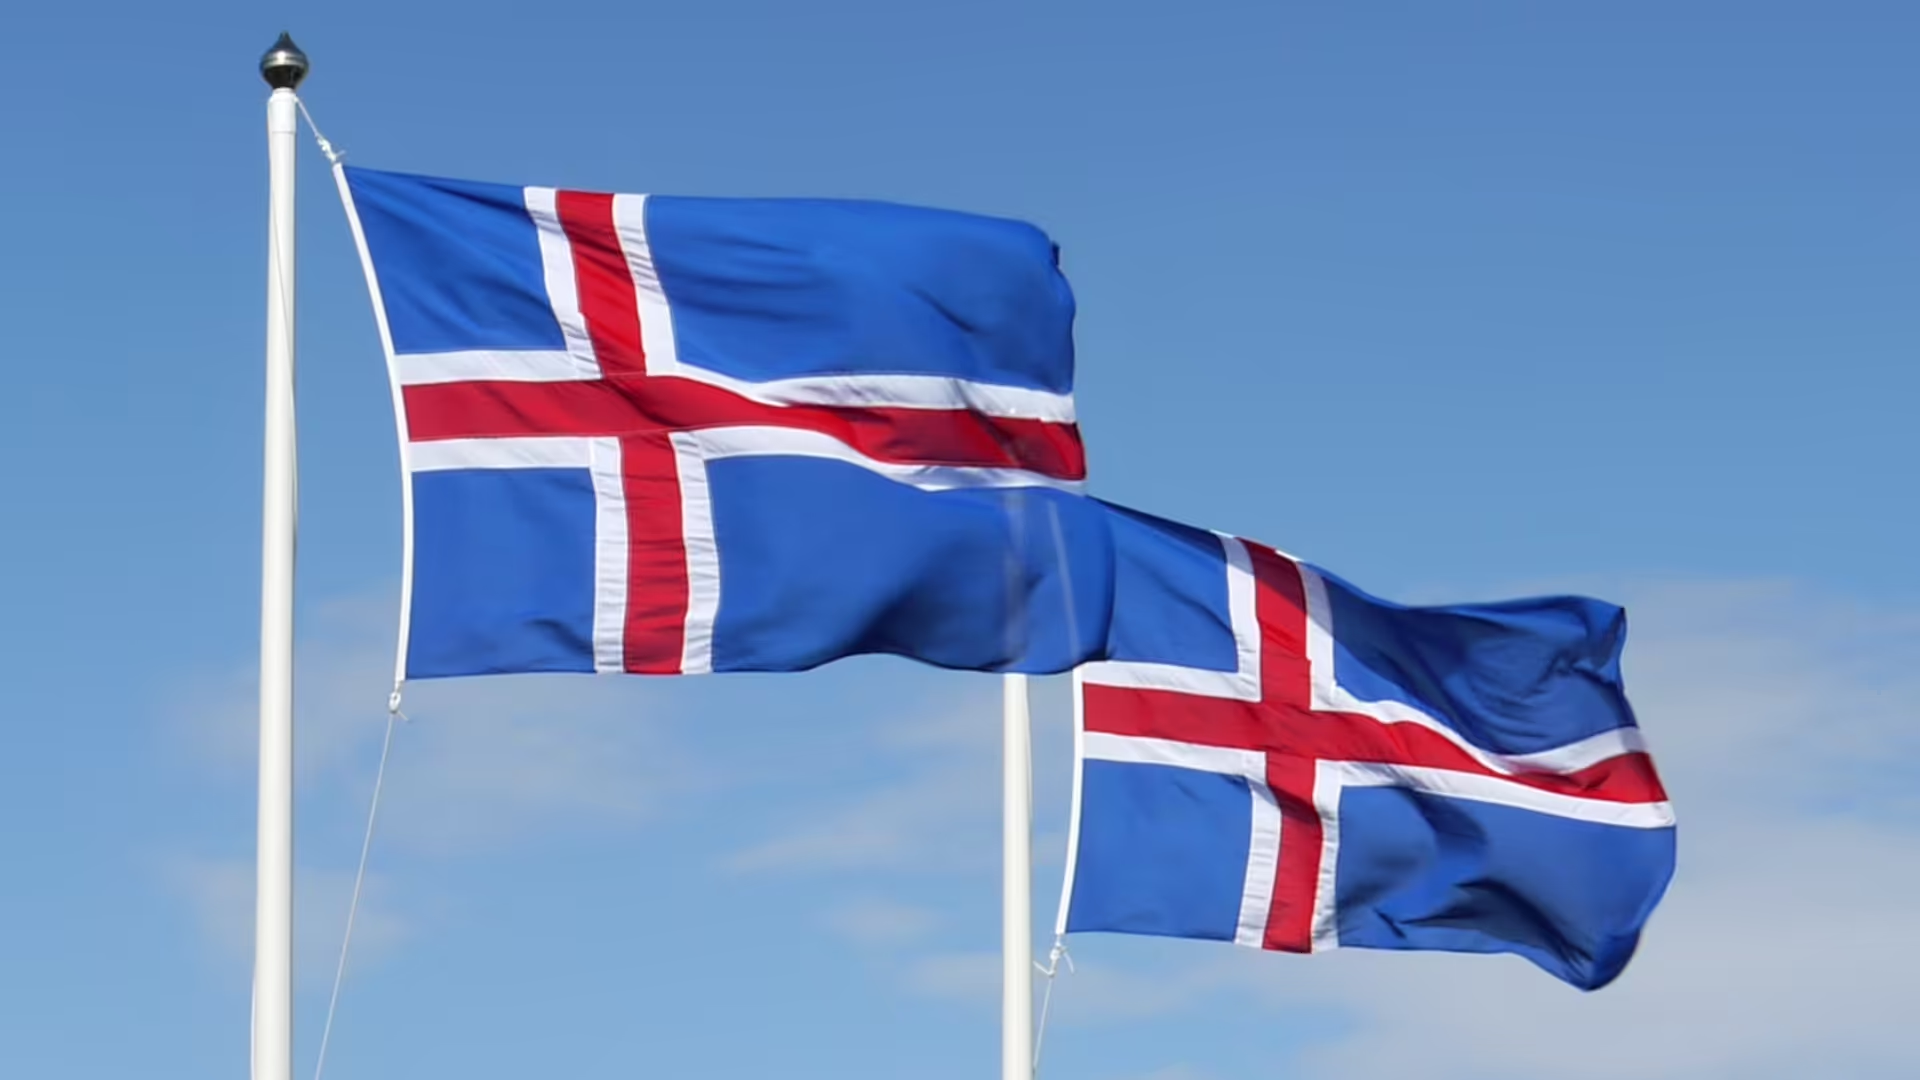
Something is not right with Emission Reporting in Iceland...
I contacted the European Environmental Agency (June 2025)
[...] we referred the matter to the Icelandic data reporter for clarification. Unfortunately, despite our follow-up, we have not received any further information from their side. [...] With this, we will close the present enquiry.
(European Environmental Agency, September 2025)
I was not satisfied with this answer
European Environmental Agency referred me to European Commission
European Commission referred me to European Environmental Agency
European Emission Trading System (ETS)

The Emission Trading System is using another dataset (Union Registry, Excel tables)
Two data sources for CO₂ emissions
(However: no shared identifier)
Linking EU ETS installations to ENTSOE-Power Plants and IEP Facilities
Jan Abrell, Mirjam Kosch, Leonard Stimpfle (CADMUS EUI Research Repository, 2025)
Elkem Ferrosilicon (Iceland, tCO₂/year)
| year | Emission Trading | Industrial Emissions |
|---|---|---|
| 2013 | 406,948 | 407,000 |
| 2014 | 369,352 | 369,000 |
| 2015 | 401,844 | - |
| 2016 | 402,484 | - |
| 2017 | 402,088 | - |
| 2018 | 403,336 | 404 |
| 2019 | 332,149 | 0.332 |
| 2020 | 357,622 | 358 |
| 2021 | 375,893 | 376 |
| 2022 | 361,901 | 362 |
Alcoa Aluminium (Iceland, tCO₂/year)
| year | Emission Trading | Industrial Emissions |
|---|---|---|
| 2013 | 583,627 | 532,000 |
| 2014 | 591,238 | 520,000 |
| 2015 | 596,581 | 531,000 |
| 2016 | 538,524 | 509,000 |
| 2017 | 558,605 | 535 |
| 2018 | 560,264 | 534 |
| 2019 | 557,975 | 536 |
| 2020 | 555,481 | 528 |
| 2021 | 515,137 | 494 |
| 2022 | 534,178 | 507 |
Power Plants Potsdam (tCO2/year)
| year | Power Plant Potsdam North ETS | Power Plant Potsdam South ETS |
|---|---|---|
| 2019 | 11,505 | 218,536 |
| 2020 | 14,334 | 212,566 |
| 2021 | 17,328 | 237,922 |
| 2022 | 13,738 | 208,718 |
| 2023 | 11,162 | 209,235 |
| 2024 | 13,994 | 201,829 |
SWP data (83 million MWh, ~13 Million tCO2) was likely MWh/KWh confusion
Data from Emission Trading System appears to be more reliable
Emission Trading System is about Money
Industrial Emissions Portal is "only" about Transparency
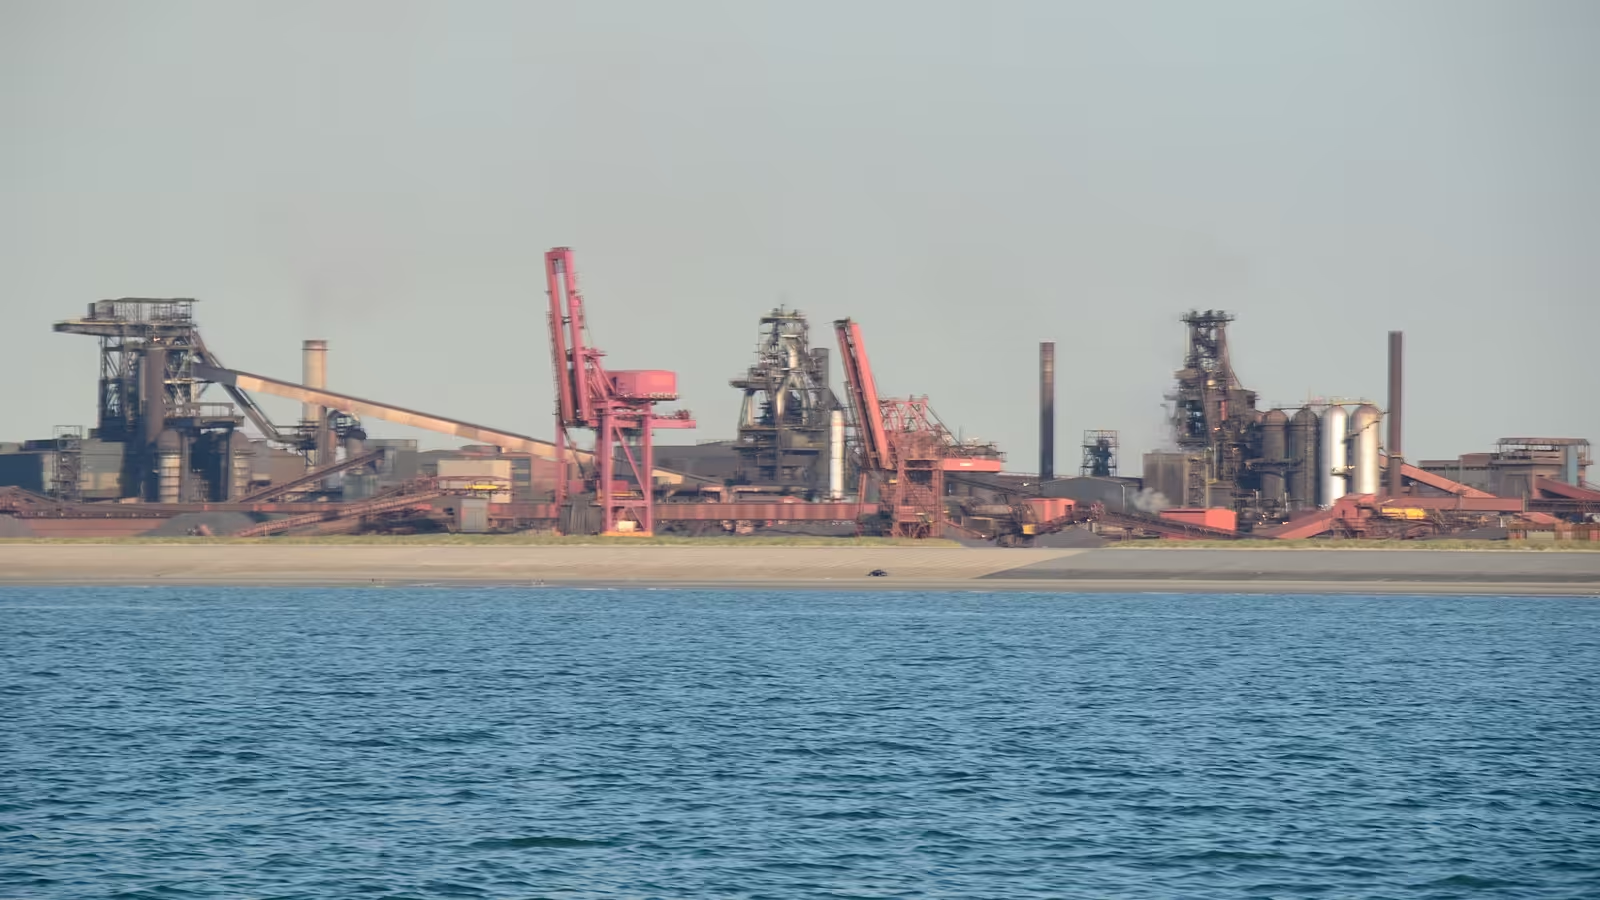
It's not just in Iceland where emission data looks odd

ArcelorMittal Steel (Dunkirk, France)
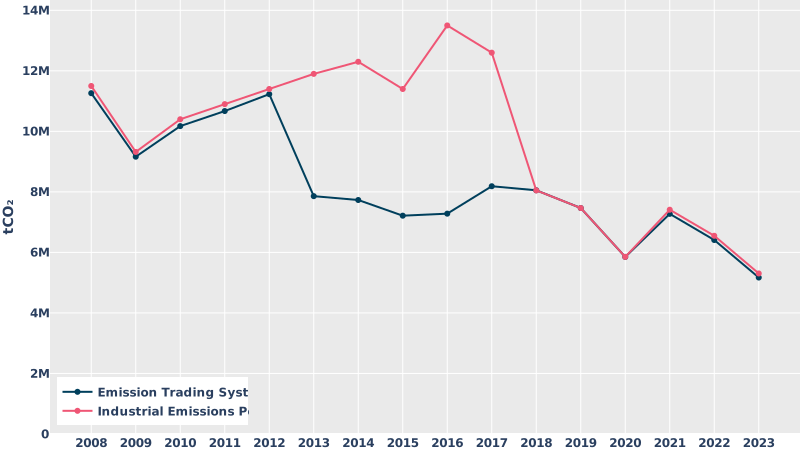
ArcelorMittal Steel/DRI (Hamburg, Germany)
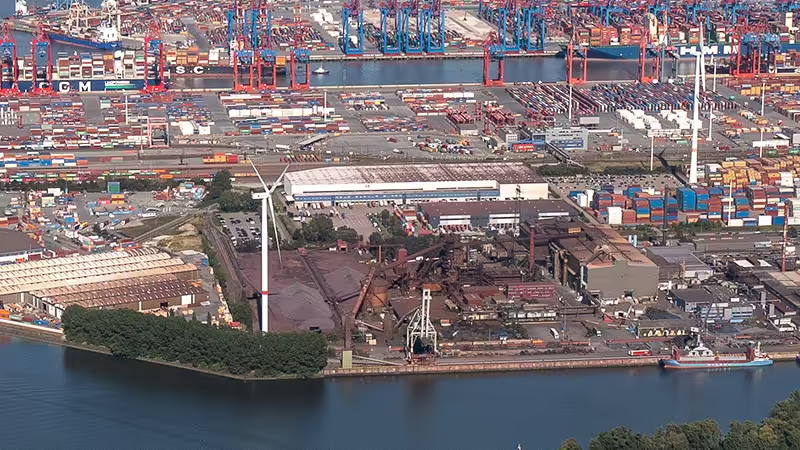
No CO₂ data in Industrial Emissions Portal

Yara Fertilizer (Ambès, France)
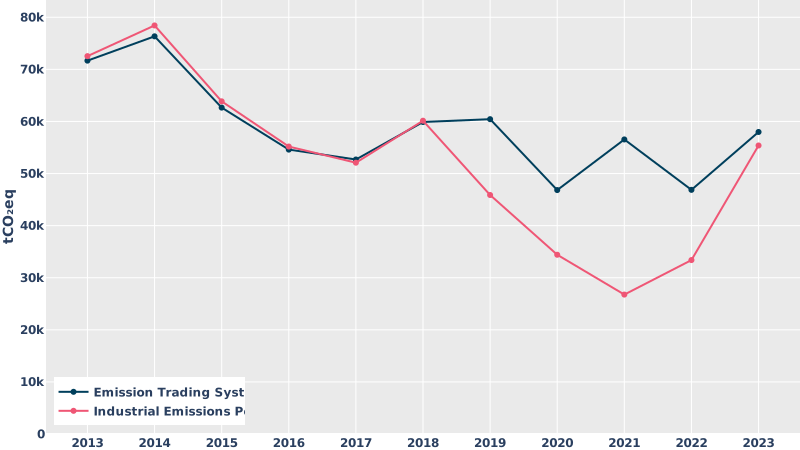
Yara's explanation
- ETS: The data is mainly derived from continuous measurements of N₂O emissions (hourly average emissions). These more accurate data are validated by an accredited body. They represent total CO₂ emissions: N₂O expressed as CO₂ from continuous measurements + CO₂ from other plant locations (auxiliary boiler, etc.). Once validated, they are filled in in the ETS section of the GEREP tool.
- Air emissions curve: these are quantities of N2O expressed in CO2 eq, which are calculated automatically by the GEREP tool based on an average flow rate and average concentration that we provide. This data is then verified and consolidated by the French authorities before being reported to the European authorities under the E-PRTR regulation.
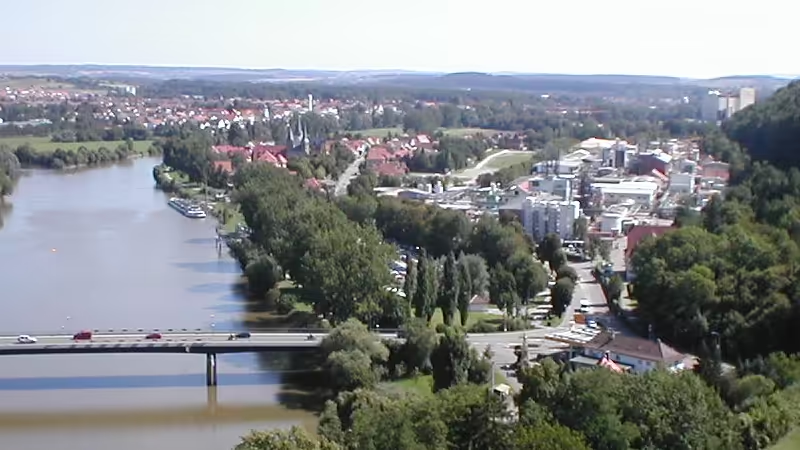
Solvay SF₆ (Bad Wimpfen, Germany)

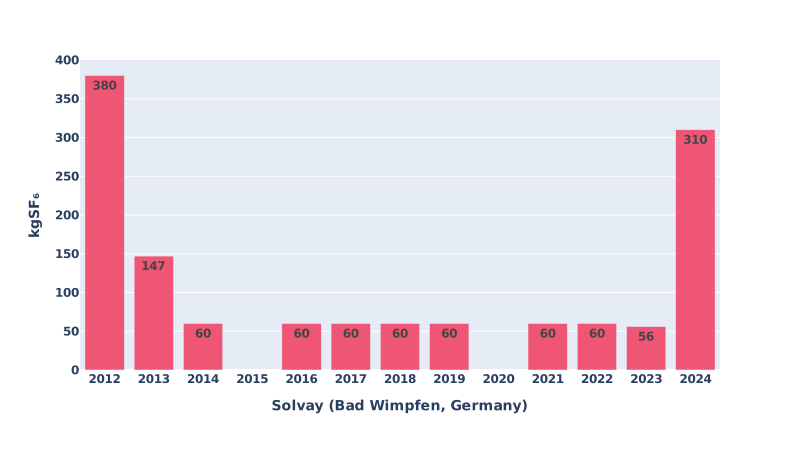
I tried to find similar "suspicious" emission sources.
The problem is that there are so many of them.
UBA: data in EU Industrial Emissions Portal can only be fixed for up to two years





No explanation from any of them
No answer from Icelandic and French authorites
No meaningful explanation from European Commission or European Environmental Agency
Data Update December 2025:
None of the mentioned issues were corrected
It is unclear what the source of those errors is.
The companies?
National authorities?
EU authorities?
For some cases with diverging data in both databases, it is unclear which source is correct
European Emission Data
- We have Open Data about Greenhouse Gas Emissions from European factories👍
- The data contains obvious and easily detectable errors👎
- The affected companies and responsible authorities don't appear to care much about correcting those errors👎
Thanks for listening!
Questions?
 industrydecarbonization.com |
 youtube.com/@decarbonizeeveryting |
Read more
- Why is it needlessly difficult to access UNFCCC Emission Data? (Nov 27 2025, Industry Decarbonization Newsletter)
- Errors and Inconsistencies in European Emission Data (Dec 30 2025, Industry Decarbonization Newsletter)